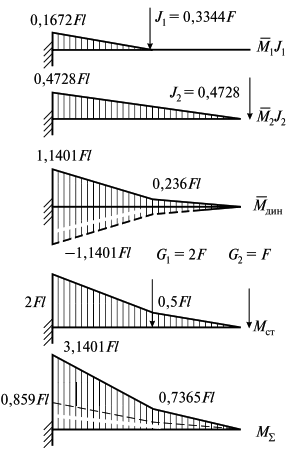
Construction of dynamic, static and total bending moment diagrams. Determination of dynamic coefficients
The diagrams ![]() and
and ![]() are shown in Fig. 12.5. The dashes show the Mdyn diagram for the case when the amplitude value of the driven force is reached at sinθt=-1 (see Fig. Mf diagram). The two dynamic diagrams are symmetrical to each other with respect to the longitudinal axis of the beam at rest. Fig. 12.5 also shows the diagram of bending moments Mst caused by the mass weight G1=m1g,G2= m2g . Taking into account that in the considered case G1=F and G2=2F, the ordinates of Mst are given in fractions of Fl. The total moment diagram MΣ is the sum at sinθt=1 or the difference at sinθt =-1 Mst and Mdyn.The difference of the ordinates of the MΣ diagram (the solid line in Fig. shows the values of MΣ at sinθt =1, the dashed lines – at sinθt =-1) determines the range of change of the bending moment in the considered section at oscillations with a given frequency θ.
are shown in Fig. 12.5. The dashes show the Mdyn diagram for the case when the amplitude value of the driven force is reached at sinθt=-1 (see Fig. Mf diagram). The two dynamic diagrams are symmetrical to each other with respect to the longitudinal axis of the beam at rest. Fig. 12.5 also shows the diagram of bending moments Mst caused by the mass weight G1=m1g,G2= m2g . Taking into account that in the considered case G1=F and G2=2F, the ordinates of Mst are given in fractions of Fl. The total moment diagram MΣ is the sum at sinθt=1 or the difference at sinθt =-1 Mst and Mdyn.The difference of the ordinates of the MΣ diagram (the solid line in Fig. shows the values of MΣ at sinθt =1, the dashed lines – at sinθt =-1) determines the range of change of the bending moment in the considered section at oscillations with a given frequency θ.
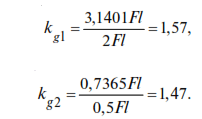
The dynamics coefficients are equal to: